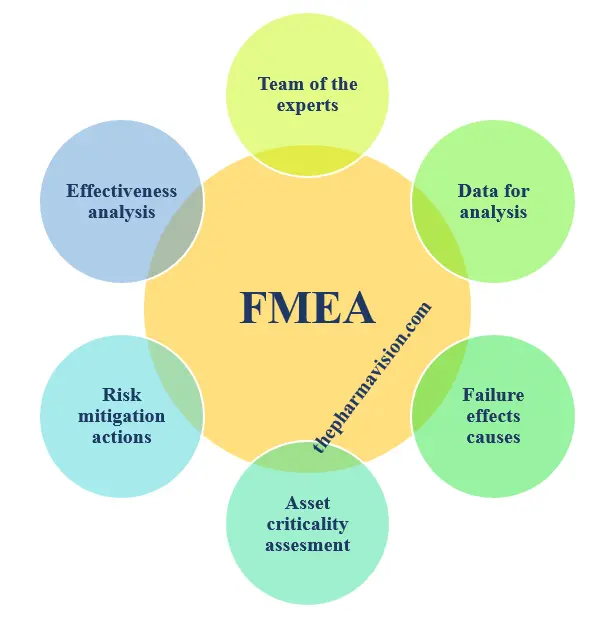
Failure Mode Effects Analysis (FMEA):
Basic steps of FMEA:

1. Describe the equipment/ process:
2. Draw a block diagram of the product or process:
3. Enumerate the items (components, functions, steps, etc.) that make up the product or process:
4. Identify all potential Failure Modes associated with the equipment/process:
4.1 A failure mode is defined as how a system or process is failing.
4.2 Potential Failure Mode is defined as a manner in which equipment/process fails to meet their specified conditions, which they are intended to perform. It describes the ways through which a failure can happen. All the known Potential Failure Modes are listed in the column according to their occurrence in their system, subsystem of the equipment/process. Failure modes are listed assuming that they could “occur” and not necessarily “occur”.
5. List down each Failure Mode using its technical term:
6. Describe the effects of each of the failure modes listed and assess the severity of each of these effects:
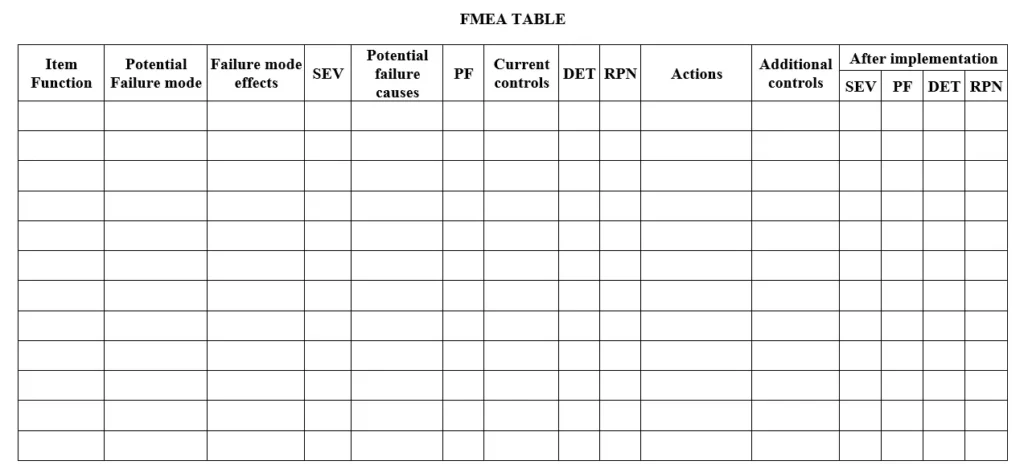
6.1 For each of the failure modes in Column 2, a corresponding effect (or effects) must be identified and listed in Column 3 of the FMEA Table. A failure effect is what the customer will experience or perceive when a failure occurs. Customers can be either internal or external, so effects on both must be considered. Examples of effects include product or process inoperability, performance degradation, user injury, and equipment damage.
6.2 Assign a severity rating to each effect. A common industry standard is to use a 1-to-5 scale system, with the ‘1’ corresponding to ‘no effect’ and the ‘5’ corresponding to maximum severity, such as the occurrence of personal injury or death with no warning or a very costly breakdown of an enormous system.
6.3 Column 4 of the FMEA Table is used for the severity rating (SEV) of the failure mode.

7. Identify the possible cause(s) of each failure mode:
7.1 Aside from its effect(s), the potential cause(s) of every listed failure mode must also be enumerated. Examples of failure causes include: improper equipment set-up, operator error, use of worn-out tools, use of incorrect software revision, contamination, etc.
7.2 The potential causes are listed in Column 5 of the FMEA Table.
8. Quantify the probability of occurrence (Probability Factor or PF) of each of the failure mode causes:

9. Identify all existing controls (Current Controls) that contribute to the prevention of the occurrence of each of these failure mode causes:
10. Determine the ability of each control in preventing or detecting the failure mode or its cause:
10.2 Detection Rating:

11. Calculate the Risk Priority Numbers (RPN):
11.1 The Risk Priority Number (RPN) is simply the product the Failure Mode Severity (SEV), Failure Cause Probability (PF), and Control Detection Effectiveness (DET) ratings. Thus, RPN = (SEV) x (PF) x (DET).
11.2 The RPN, listed in Column 9 of the FMEA Table, is used in prioritizing items that need additional quality planning or action.
12. Risk Percentage (R%):
12.1 Risk Priority Numbers obtained have been scaled down to percentage levels for easy interpretation of results. This is done by taking the worst-case scenario where the RPN obtained would be 125 (severity-5, probability of occurrence-5, detection capability-5).
R % = Obtained RPN for a Failure X 100
Maximum obtainable RPN for a Failure
Risk in a Worst-Case Scenario
(Severity = 5, Probability of Occurrence = 5, Detection Capability = 5)
RPN = S x PF x D
= 5 x 5 x 5
= 125
(To simplify the RPN obtained it is scaled down to the percentage level, where it is very easy to interpret results)
R % = 125 (Obtained RPN for a Failure) X 100 = 100 %
125 (Maximum obtainable RPN for a Failure)
12.2 Each of the risk percentage must be listed in Column 10 of the FMEA Table.
13. Risk Percentage Scale:
13.1 This scale is designed to classify risks in a simpler and efficient mode. The risk percentage obtained is classified into three categories; acceptable, unacceptable and intolerable. This is based on the number obtained. Any risk percent below 5% is classified as Acceptable. If the risk percent obtained falls between 5% and 19% then it is classified as Unacceptable. Risk percent obtained falls above 20%, and then it is termed as intolerable.
13.2 Each of the risk percentage must be listed in Column 11 of the FMEA Table.
14. Identify action(s) to address potential failure modes that have a high RPN:
14.1 A high RPN needs the immediate attention of the user department/engineer since it indicates that the failure mode can result in an enormous negative effect, its failure cause has a high likelihood of occurring, and there are insufficient controls to catch it. Therefore, action items must be defined to address failure modes with high RPNs, particularly those that are unacceptable and intolerable.
14.2 If the risk percent is termed acceptable then equipment/process or system passes the risk analysis. Actions are not recommended to reduce the risk any further. If the risk percent falls under unacceptable category then actions are recommended to reduce the risk involved to acceptable level or determine the scope and extent of validation. Though risk is recommended to be reduced it does not pose a great threat. The risk poses a great threat if the risk percent falls under intolerable levels. High risk is to be reduced to normal levels without delay.
14.3 These actions include but should not be limited to the following: inspection, testing, monitoring, redesign, de-rating, conduct of preventative maintenance, redundancy, process evaluation / optimization etc.
14.4 Column 12 of the FMEA Tables is used to list down applicable action items.
15. Review the results of the actions taken and reassess the RPN's:
15.1 After the defined actions have been completed, their over-all effect on the failure mode they are supposed to address must be reassessed. The engineer must update the SEV, PF, and DET numbers accordingly. The new RPN must then be recalculated once the new SEV, PF, and DET numbers have been established.
15.2 Columns 13, 14, 15, and 16 of the FMEA Table are used to indicate the new SEV, PF, DET, and RPN, respectively.

Also read: SOP for quality risk management.
Also read: SOP for Handling of deviation
References:
ICH guideline Q9 on quality risk management
